

Hi, I'm
Hannah Rose
Data Scientist

Hi, I'm
Data Scientist

B.S. Informatics:
Data Science
UW
2026

Business Analyst / Data Science Intern
QuieTrack Insurance Services
IT Intern
Heffernan Insurance Brokers

Knitting
Reading
Crosswords
HayDay
Making Jewelry
Loose-Leaf Tea
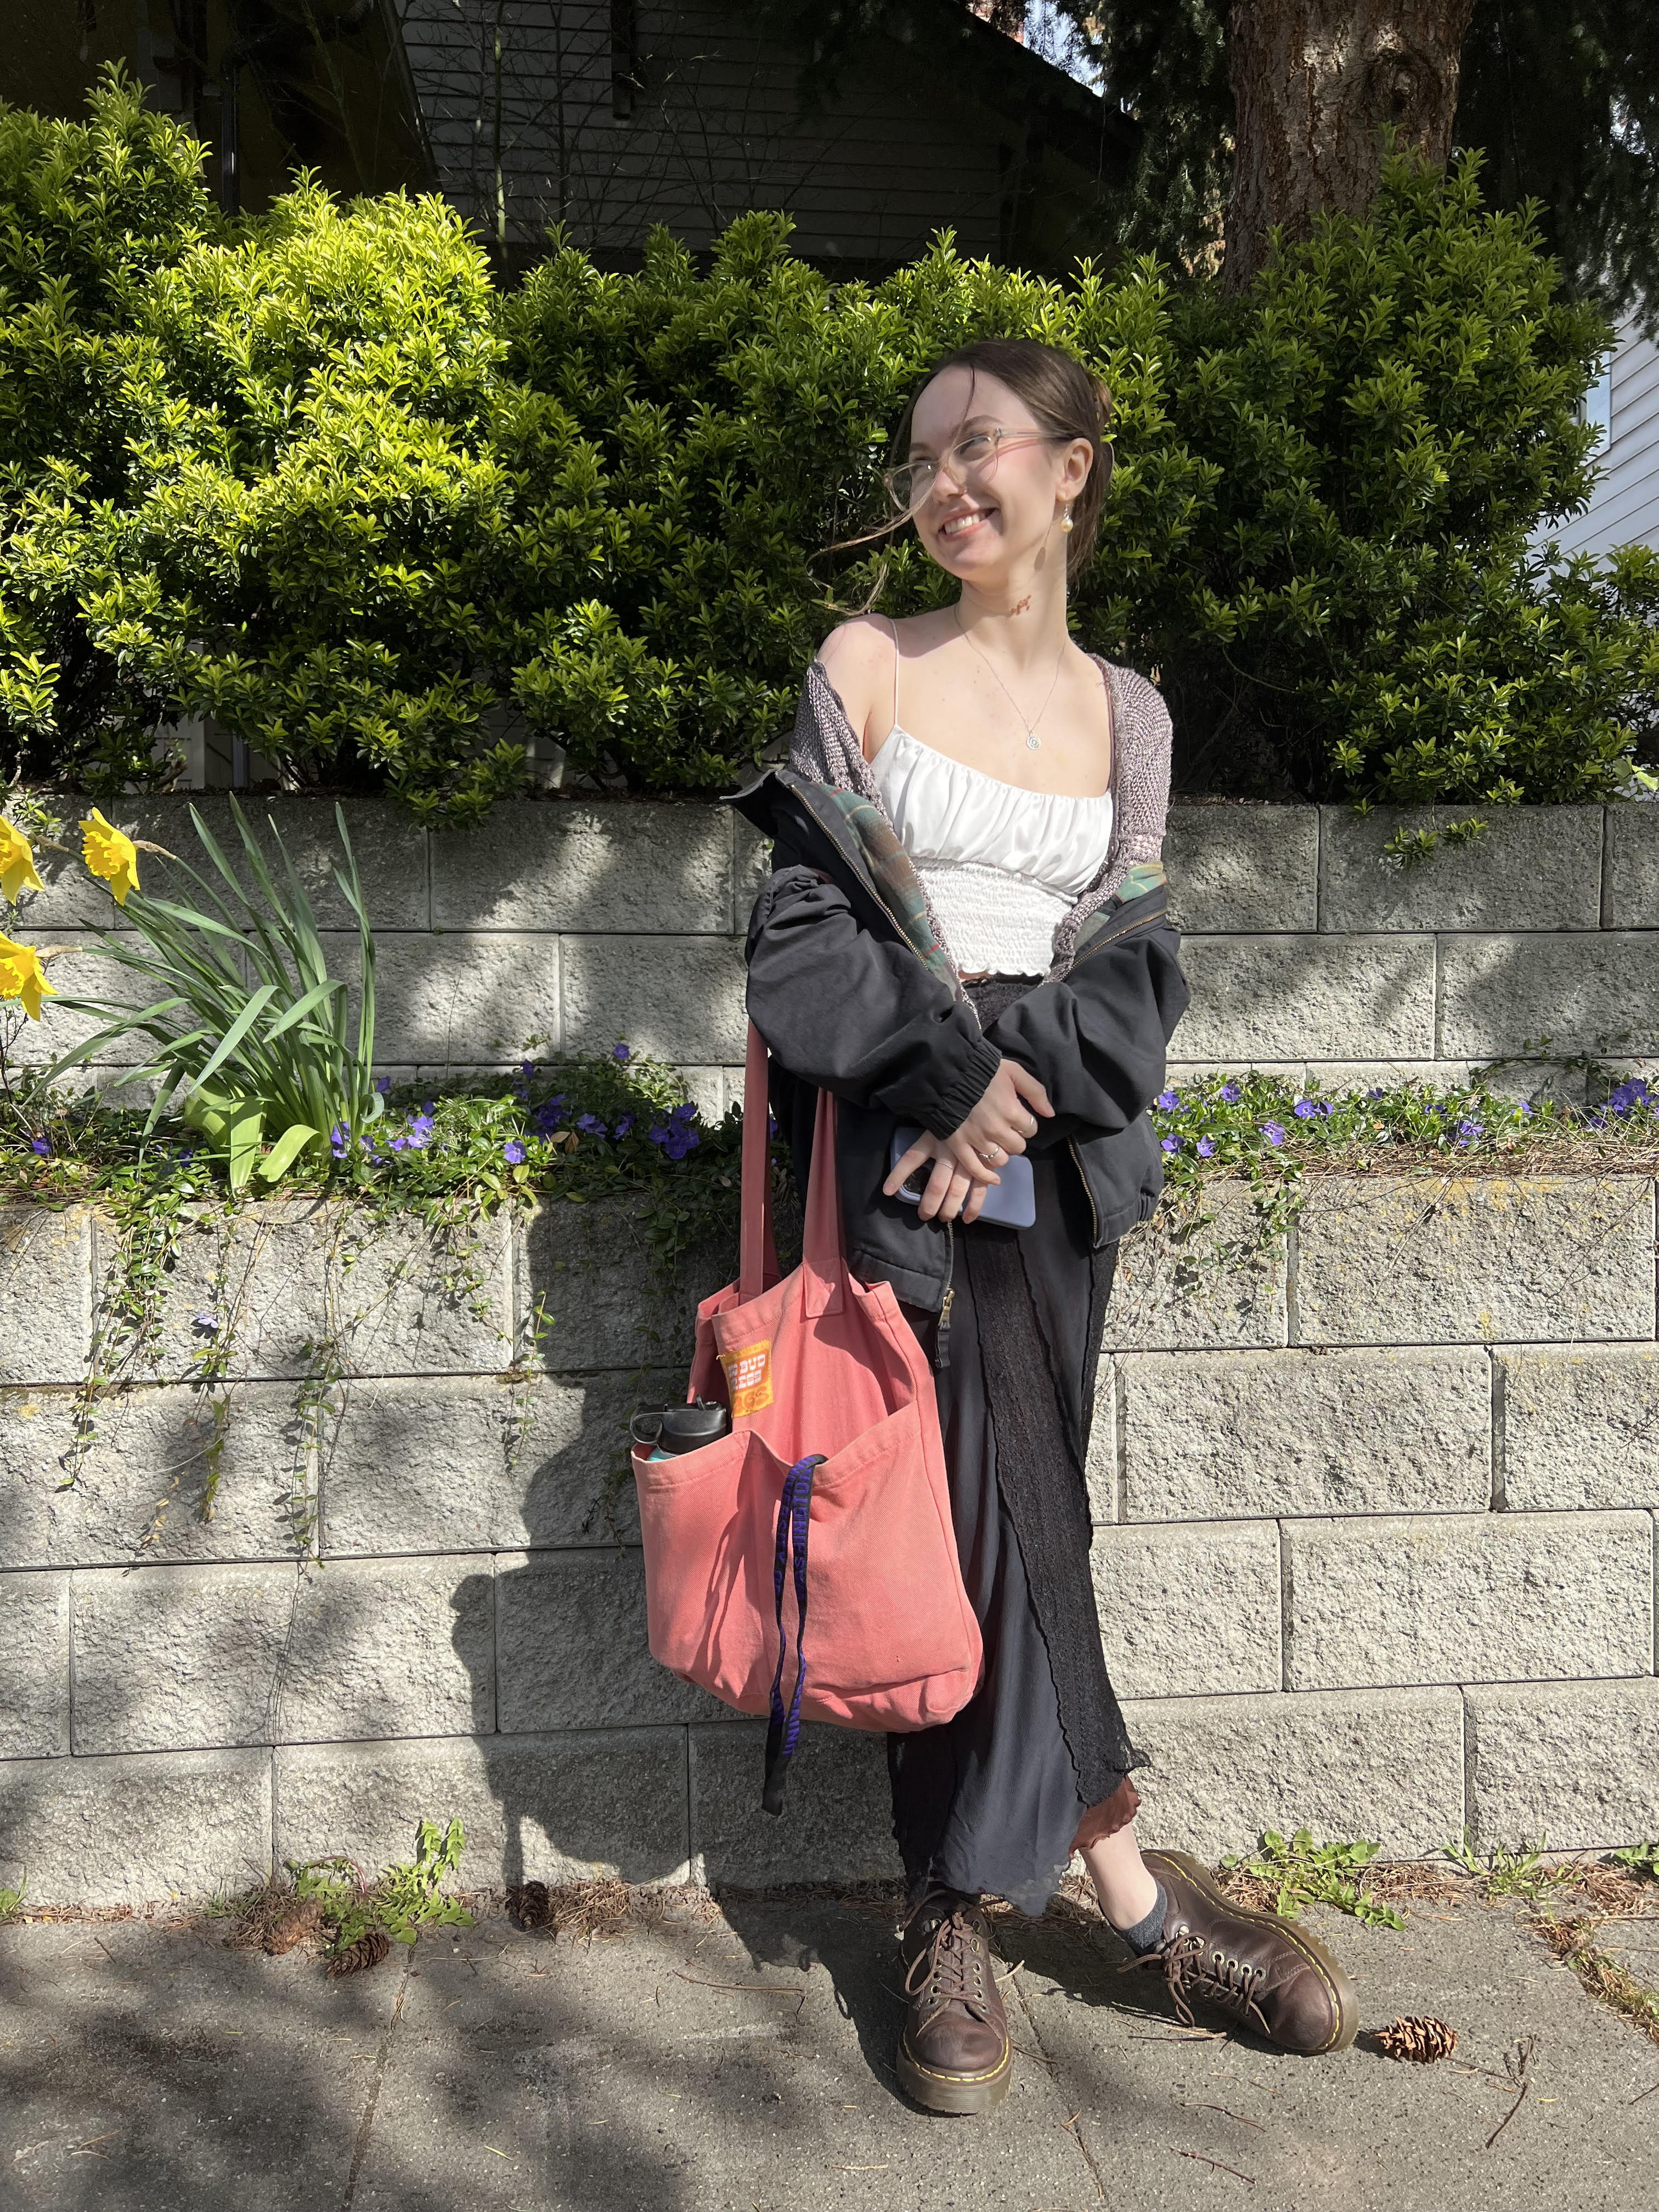
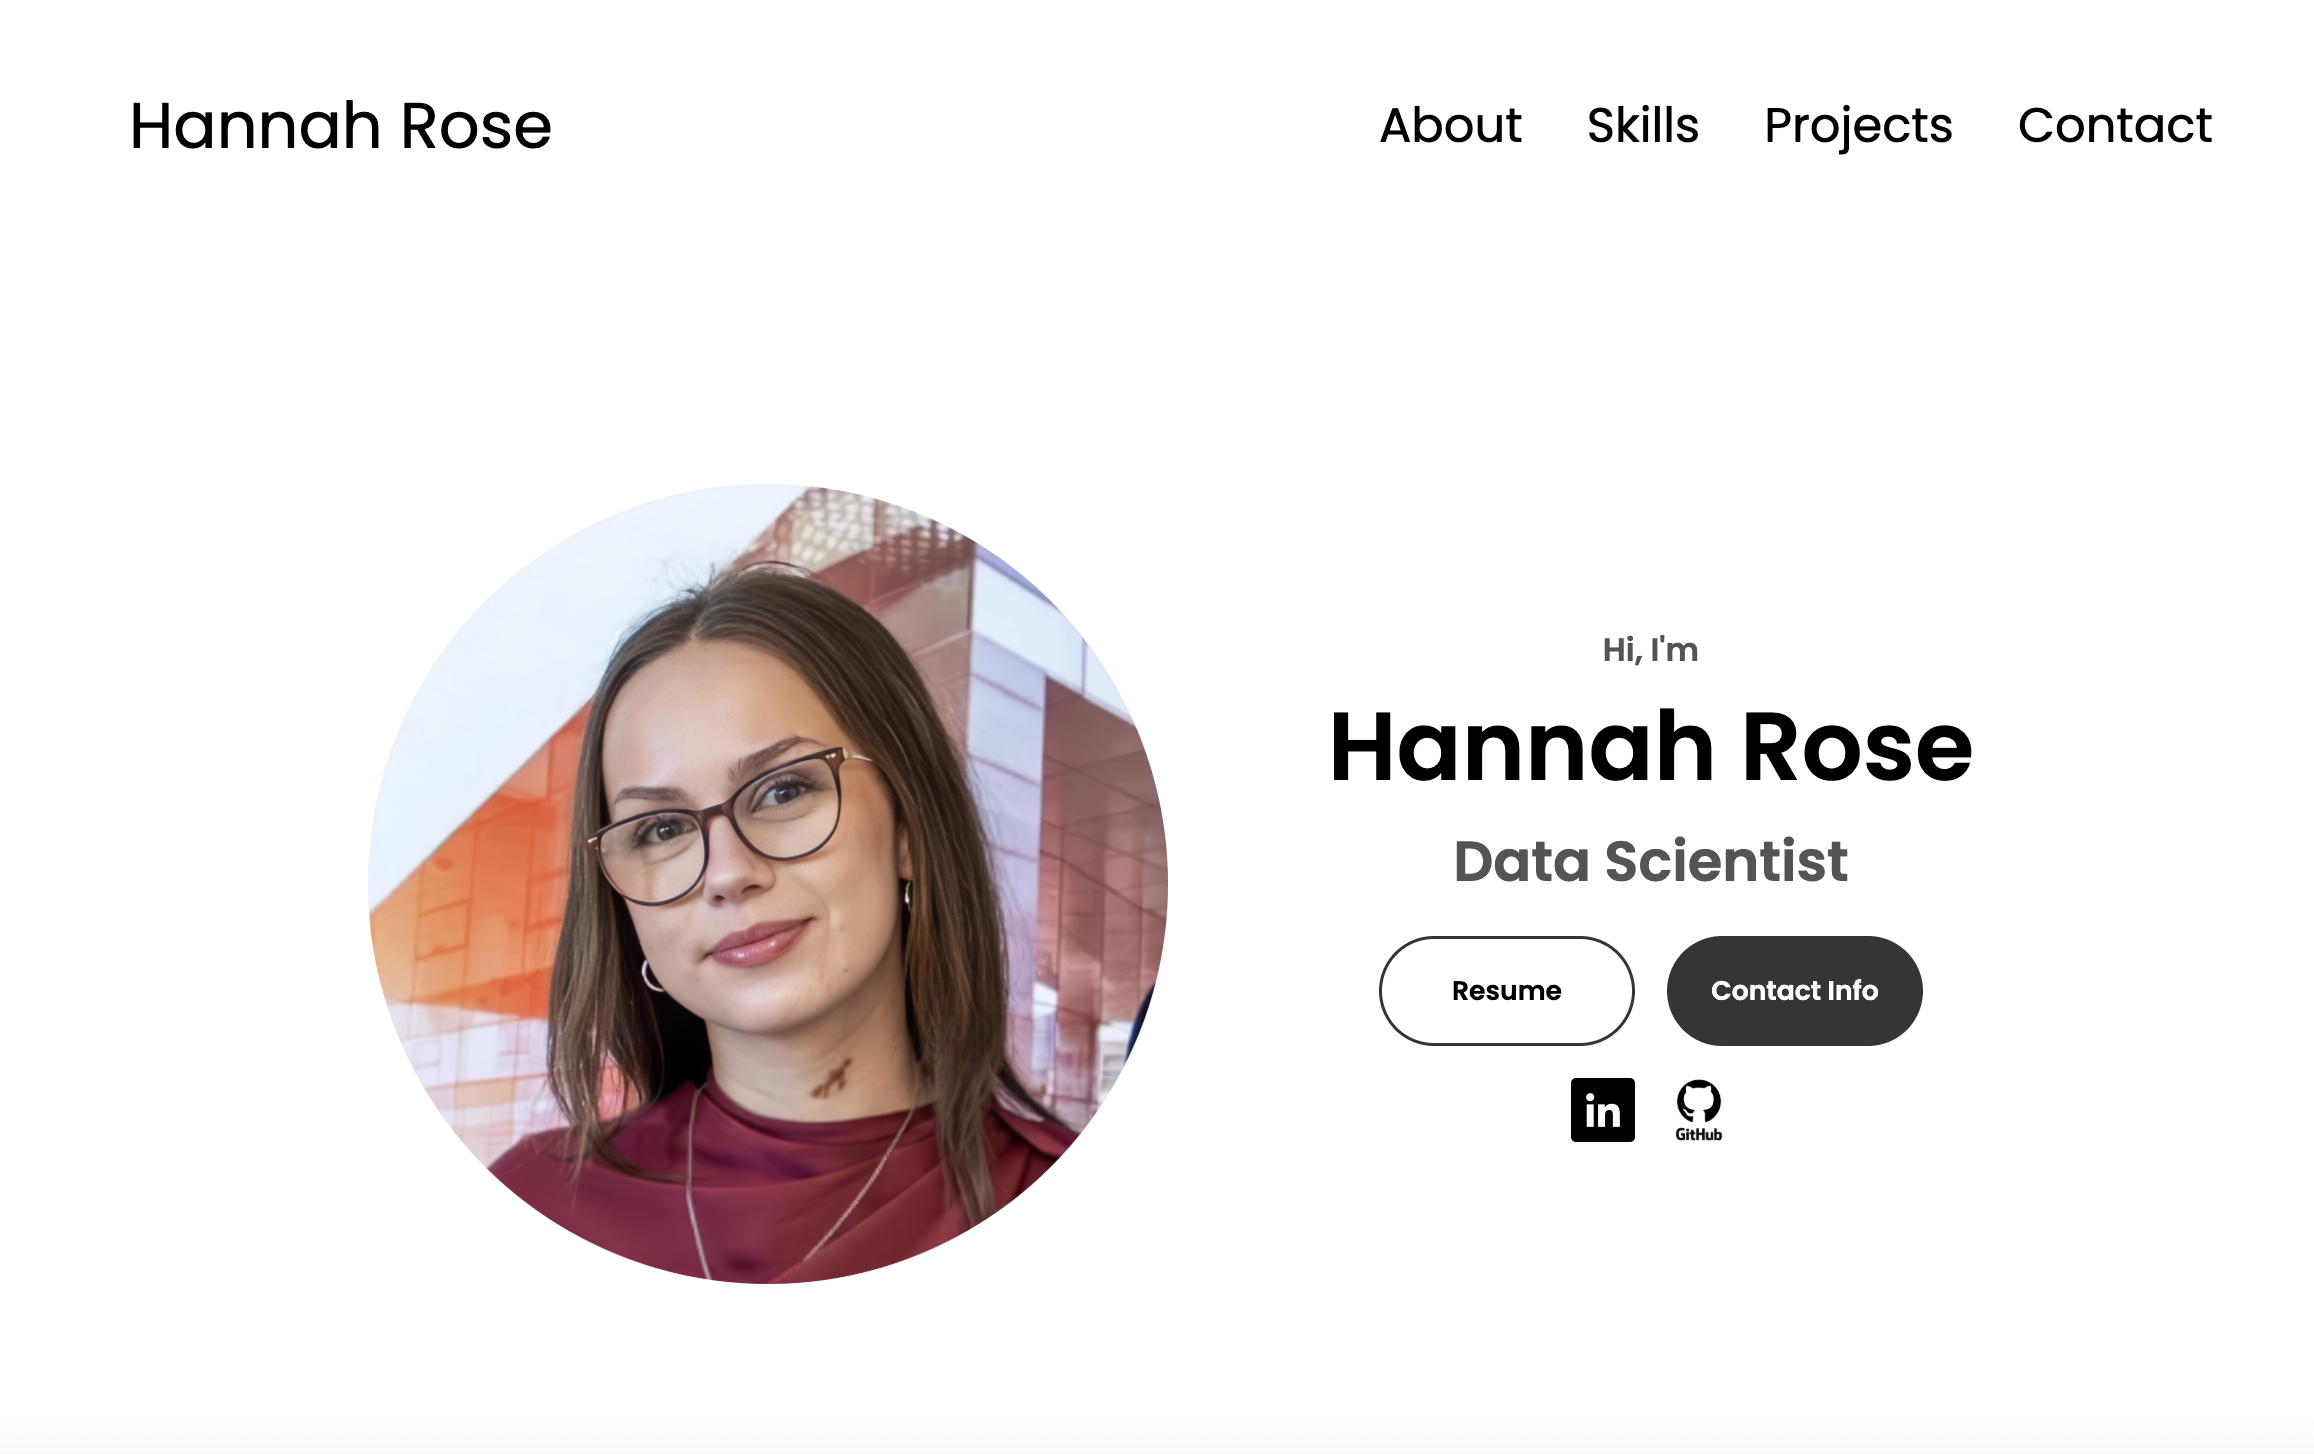
Hi, I'm Hannah! I'm an Informatics student at the University of Washington studying Data Science. From exploratory data analysis to machine learning, I love digging deeper into data to uncover useful information that might otherwise go overlooked. I believe that data can be incredibly powerful if you know what to look for, and that's where my primary interest lies.
In my free time, I like to knit, read (I am always taking book recs!), and do crosswords.

Python, Scikit-learn
Tableau, PowerBI, plotly
SQL, SQL Server
Pandas, NumPy, dplyr
Power Query, Python, R
Git, GitHub, GitLab

Using Scikit-learn, pandas, and NumPy, I created a machine learning model to predict the prices of art pieces based on a variety of factors including subject, style, medium, and mood from tabular data. I performed K-Fold Cross-Validation to select between a k-Nearest-Neighbors and Ridge Regression model. I used MSE, MAE, and MRE to evaluated the final model's prediction accuracy and determine whether the model tended to over- or under-predict art prices. I also created visualizations using Plotly, evaluating how the model performed on different price ranges and art styles.
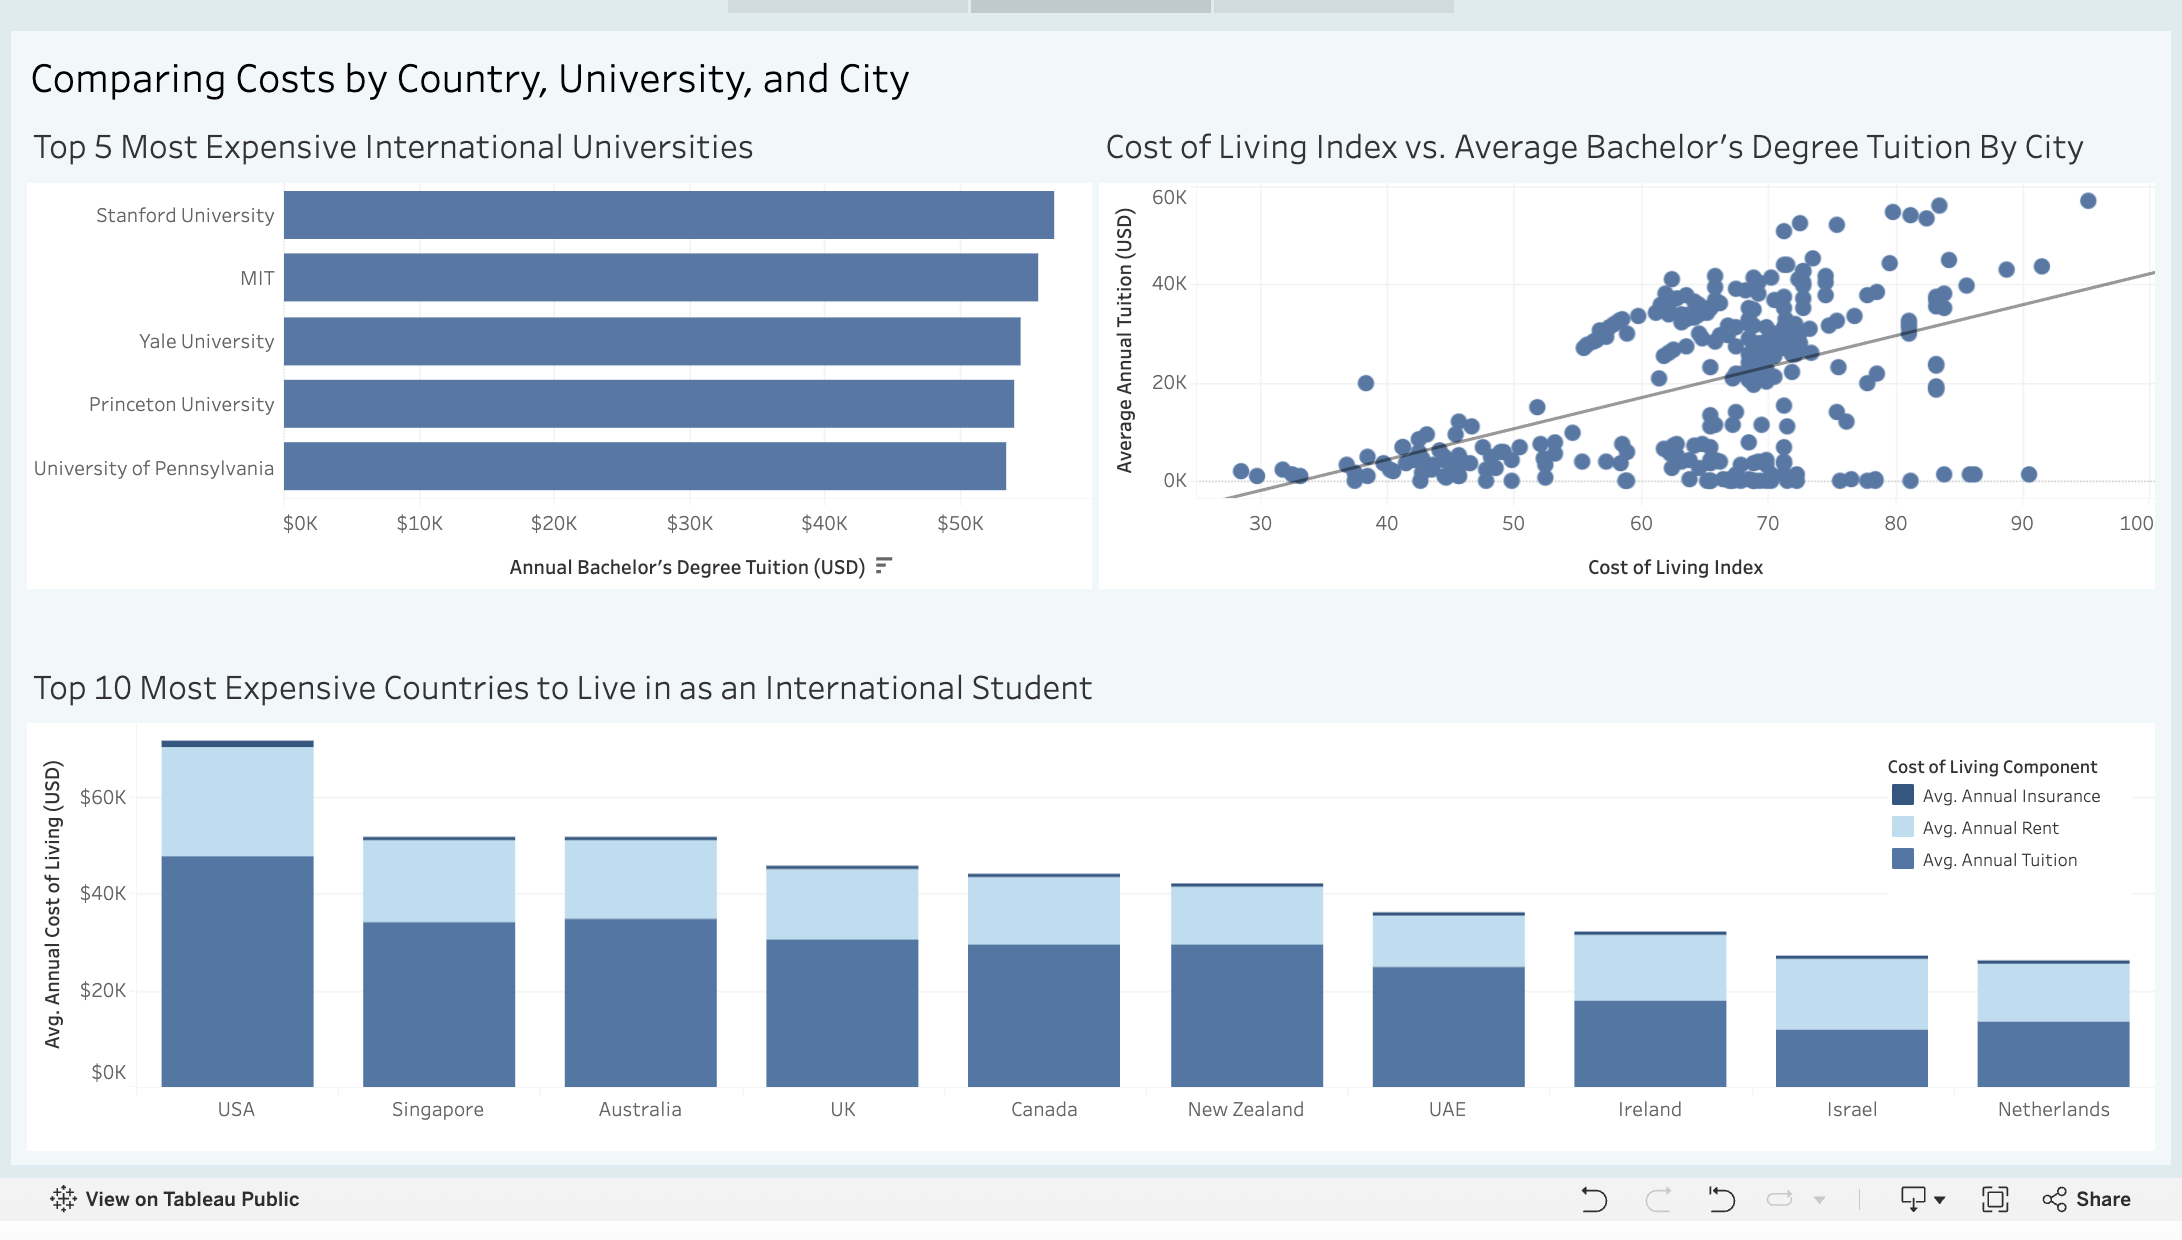
For my Interactive Information Visualization class, I created a Tableau data story examining student living expenses by university country, city, degree level, and major using public university and cost of living data sourced from Kaggle. I first created a draft dashboard in Excel, then imported and wrangled data in Tableau Prep Builder, and built out the final dashboard in Tableau. I discovered that the United States was the most expensive country to study abroad in by across the board, followed by Singapore, Australia, the UK, Canada, and New Zealand.
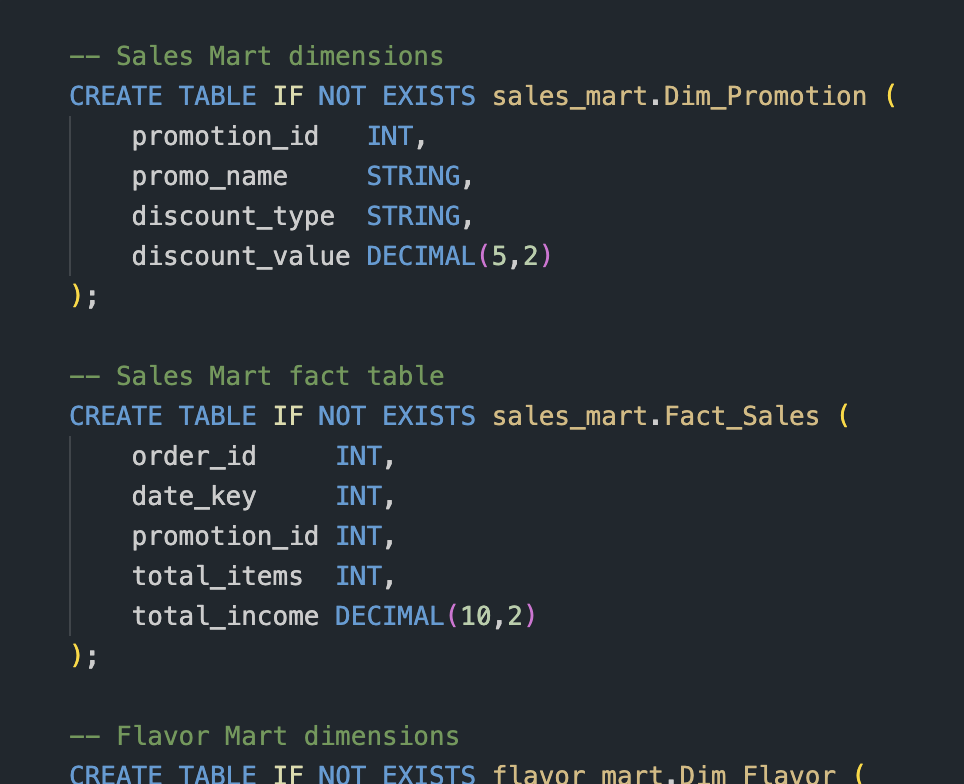
For my Database Design and Management class, I designed and built a multi-part database system for a fictional ice cream shop. I started by designing an OLTP schema to support day-to-day shop operations, then built out a dimensional data warehouse with Sales and Flavor/Menu star schemas for reporting. I developed a Spark and Databricks ETL pipeline to move data from source to warehouse, and finished by designing a MongoDB-based customer loyalty program to explore NoSQL data modeling alongside the relational work.

Girl Scouts of Western Washington, WMarketplace
For my capstone, I worked in a team of five, partnering with the Girl Scouts of Western Washington and WMarketplace, to create the first-of-its-kind Washington State of the Girl Report. Our goal was to provide a snapshot of how girls are doing in WA to guide policy, funding, and programming decisions. We researched how girls are performing in five main categories – physical health, emotional health, social wellness, academic and career readiness, and safety – and created a detailed report showcasing our findings. My primary focus was the research, design, and creation of the Emotional Health section.
Heffernan Insurance Brokers
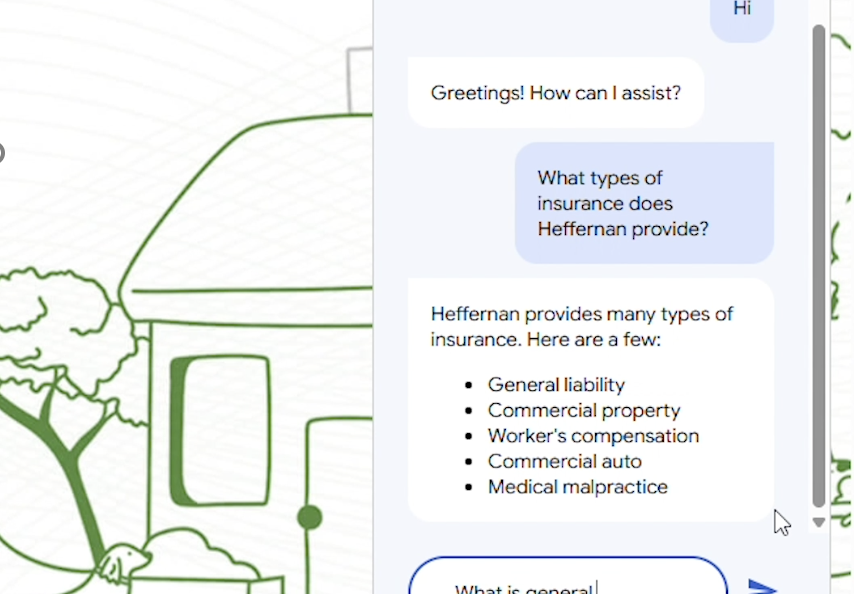
During my internship with Heffernan Insurance Brokers, I led a four-person group in designing and piloting a custom customer support chatbot to their company website using Google DialogFlow. I performed a competitive analysis on several chatbot platforms, evaluated client use cases, and designed and developed the chatbot based on stakeholder requirements. As project manager, I coordinated team meetings, ensured deliverables were completed on time, led the development process, and presented our result and recommendations for rollout to company executies.
For fun
Woah, meta.
I figured it would be way cooler to be able to say that I built my own portfolio website than to use a website builder. I am definitely no web developer, but I was able to use the skills I gained from my Client Side Development class to build this portfolio website with some basic HTML, CSS, and JavaScript. I managed version control with GitHub and deployed the website using CloudFlare. In total, this only took me about 2 days. Not too bad, if I say so myself.
Get in Touch